Making Your Power BI Teams More Analytic - Tracking Changes
In the last article, I provided a detailed overview of the tools, setup, and general process required for your Power BI teams to generate the data needed for better analytics. In this article, we’ll cover how to leverage Azure DevOps to track changes to our Power BI reports and semantic models.
Why is this important?
We need to know which Power BI reports or semantic models have changed so we can identify which reports require immediate analysis, testing, and deployment. Tracking changes also allows us to log when modifications occurred and when analyses or tests were conducted. As with most analyses in our industry, time is a critical dimension, so we must consider that in our Azure Pipelines.
How do we track changes?
With just a few lines of Git code, we can accomplish this:
# Get changed files in the Semantic Model and Dataset folders
$pbipSMChanges = @(git diff --name-only --relative --diff-filter=d HEAD~1..HEAD -- '*.Dataset/**' '*.SemanticModel/**')
$pbipSMChanges += @(git diff --name-only --relative --diff-filter=d HEAD~2..HEAD -- '*.Dataset/**' '*.SemanticModel/**')
$pbipSMChanges = $pbipSMChanges | Sort-Object -Unique

# Get changed files in the Report folder
$pbipRptChanges = @(git diff --name-only --relative --diff-filter=d HEAD~1..HEAD -- '*.Report/**')
$pbipRptChanges += @(git diff --name-only --relative --diff-filter=d HEAD~2..HEAD -- '*.Report/**')
$pbipRptChanges = $pbipRptChanges | Sort-Object -Unique
This code checks for changes in the last two commits. Why two commits?
Often, when merging work into your Azure DevOps repository, Visual Studio Code will generate two commits. I’m sure a Git expert (which I won’t claim to be) could explain this in more detail, but through experience, I’ve learned that to accurately capture all changes to reports and semantic models, checking the last two commits is necessary.
Additionally, we are only scanning changes within folders containing suffixed by .SemanticModel and .Report. This filtering allows us to examine the PBIP format and focus on relevant modifications—such as DAX measure updates, visual changes, or Power Query changes—while ignoring extraneous modifications.
With these core lines of code, we can begin building Continuous Integration by creating an Azure Pipeline that, upon each commit, performs the following steps, as illustrated in Figure 1.
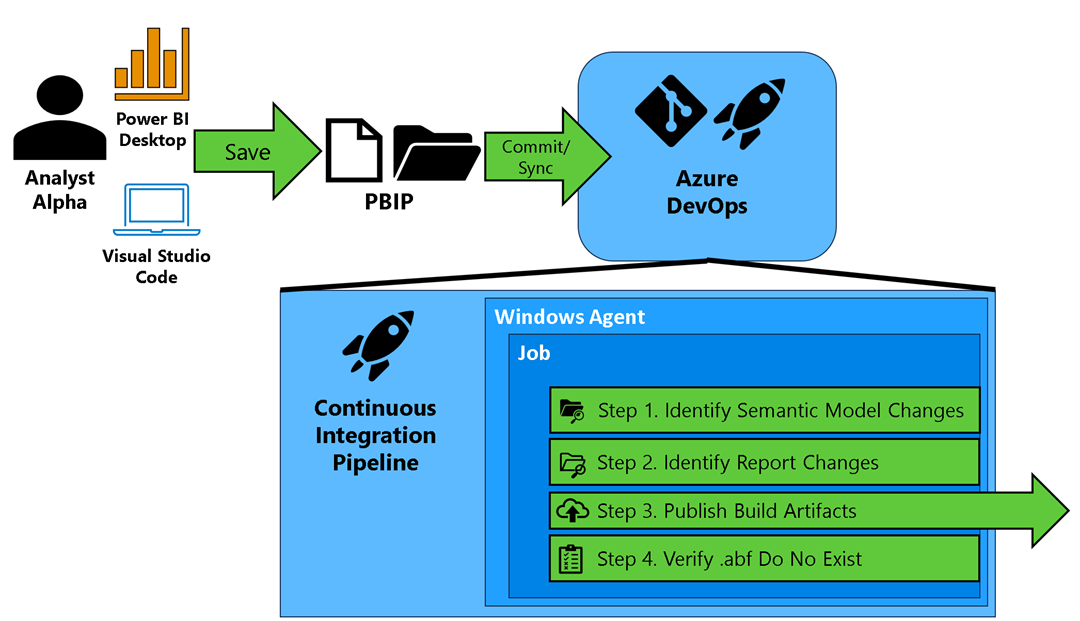 Figure 1 – Illustration of Continuous Integration Pipeline
Throughout this series, I’ll be using some Azure DevOps terms which I have sourced directly from Microsoft documentation:
- Trigger - A trigger kicks off a pipeline. A common trigger is when a sync occurs on a branch.
- Pipeline - A pipeline is made up of one or more stages.
- Stage - A stage is a way of organizing jobs in a pipeline and each stage can have one or more jobs. We’ll have one stage for the Continuous Integration pipeline for this blog post.
- Job - Each job runs on one agent.
- Agent - Each agent runs a job that contains one or more steps. The Continuous Integration pipeline will run on a Windows agent provided by Microsoft (known as a Microsoft-hosted agent).
- Step - A step can be a task or script and is the smallest building block of a pipeline.
- Task - A task is a prepackaged script that performs an action, such as invoking a REST API or publishing a build artifact.
- Artifact - An artifact is a collection of files or packages published by a run.
- Run - A single execution of the pipeline.
- YAML - A pipeline is defined using YAML (Yet Another Markup Language), which specifies the agent, jobs, and instructions on what steps to execute and which code to run. Within the YAML file, you can also execute other code (e.g., PowerShell, Python, etc.), effectively making it a script that tells Azure DevOps what code should be executed.
With the jargon defined, here are the tasks executed in each step of a single run of the Continuous Integration pipeline:
Identifying Semantic Model Changes Using the Git command, we identify each semantic model change and package the necessary metadata to pass that information along for analysis. This includes the commit ID under which the change occurred. A commit ID is a unique identifier for a change made in the Azure DevOps repository, allowing us to track who made the change and when it occurred.
Identifying Report Changes Similar to semantic model changes, we also identify report changes and package the necessary metadata for analysis.
Publishing Build Artifacts Once we have identified the relevant reports and semantic models, we publish the content as build artifacts. This process copies the semantic model and report folders—along with their contents—into a package that can be leveraged by downstream Azure DevOps Pipelines. I’ll cover this topic in more depth in future articles.
Note: The term “publish” here refers to Azure DevOps and does not mean publishing reports or semantic models to a Power BI workspace.
Ensuring .abf Files Are Not in the Repository Lastly, we double-check that no .abf files exist in the repository. Why? .abf files contain actual data stored in a semantic model, and for security reasons, they should not reside in our repositories. In fact, the .gitignore file generated when using the PBIP format explicitly excludes .abf files from commits.
This step ensures that no one has unintentionally circumvented this best practice—often due to a lack of knowledge about .abf files or the purpose of .gitignore. If a .abf file is found, the build fails. By default, a failed build notifies the project manager role within the Azure DevOps project, alerting them to a security concern. Depending on your security requirements, this step can be moved earlier in the pipeline process.
Implementation
Hopefully, this gives you an adequate understanding of what the Continuous Integration pipeline does, so let’s review how to set it up. If you’ve completed instructions from the prior section, you need to perform the following:
Fetch Changes from Upstream
Open Visual Studio to the folder we setup in the prior section.
Verify the branch you are on by looking at the lower left-hand corner of the Visual Studio code. You should be at the development branch. If you see that it does not say development, please open the terminal.
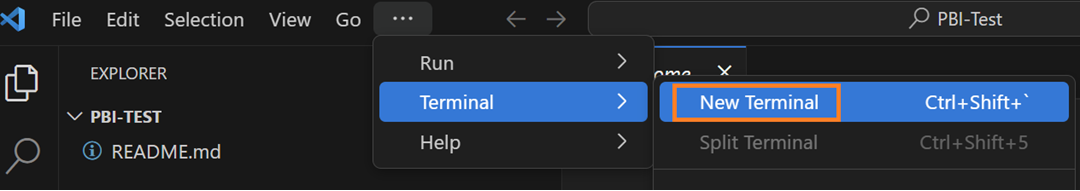 Figure 2 – Example of opening the terminal again
Then enter the command “git checkout development”. This will switch the branch to development.
 Figure 3 – Example of git checkout to switch to development
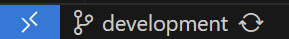 Figure 4 – Example when Visual Studio Code is on the development branch
We now need to temporarily add the GitHub repository I created as an additional remote repository.
Why? Well, as we progress through this series, I want to give you the ability to resync with the template repository to pick up new scripts. From Visual Studio Code’s top menu, select Terminal → New Terminal.
 Figure 5 – Opening the Terminal Window
A terminal window should appear near the bottom of the Visual Studio code. Enter the command line: “git remote add upstream https://github.com/kerski/pbi-teams-more-analytic.git”
 Figure 6 – Adding the GitHub template repo for remote updates
In the terminal’s command line type in “git fetch upstream”. This will pick up on any new changes since you completed the instructions in the prior section.
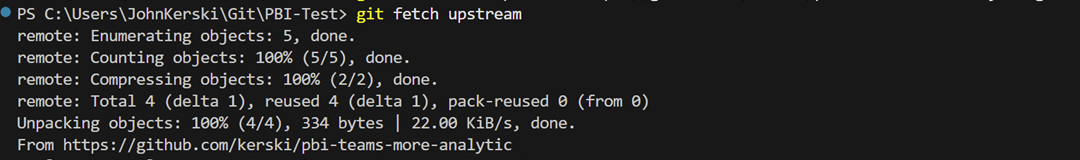 Figure 7 – Fetching changes from the GitHub template
In the terminal’s command line type in “git remote remove upstream”. This will remove the linkage to the GitHub repository and retain your Azure DevOps repository as the primary place to save work. Note: Don’t forget this step!
 Figure 8 – Removing the GitHub template repo from remote updates
Within new Scripts folder, verify a file called pbi-ci.yml is there.
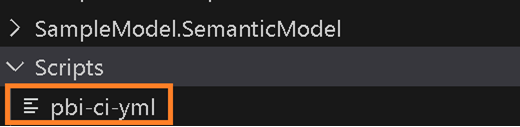 Figure 9 – Example of pbi-ci.yml synced
Commit and sync your changes to your Azure DevOps repository.
Setup the Pipeline
Navigate to the Pipeline page in your Azure DevOps project.
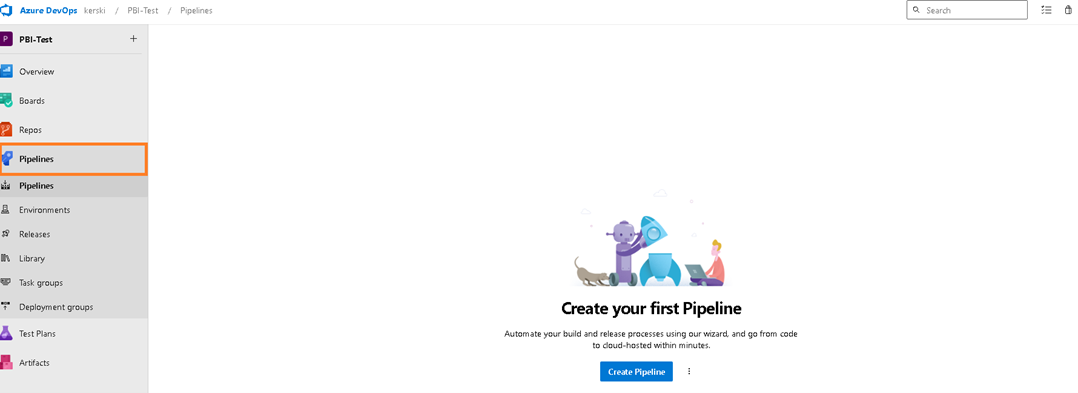 Figure 10 – Example of Pipeline
Select the Create Pipeline button.
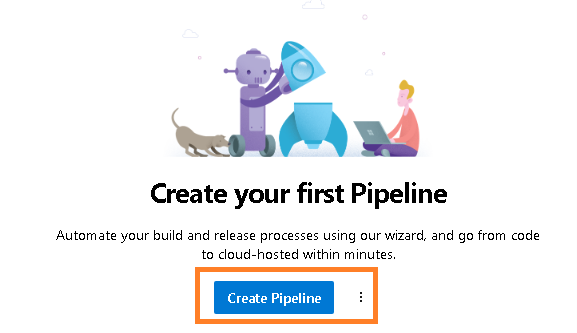 Figure 11 – Select the Create Pipeline button
You will be presented with the question “Where is your code?”. Select the Azure Repos Git option.
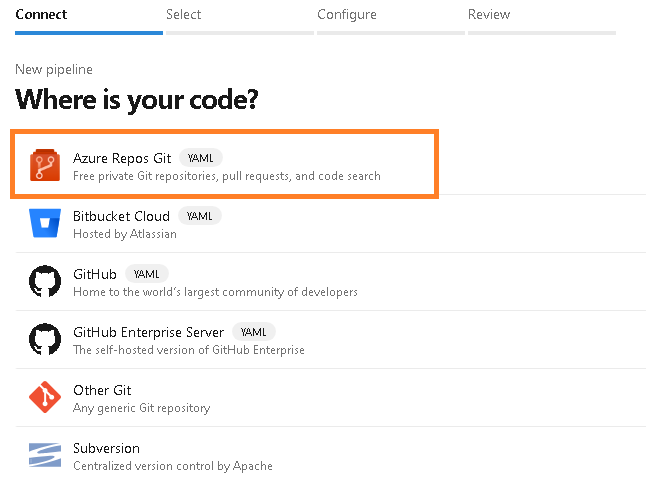 Figure 12 – Select the Azure Repos Git option
You will be prompted to select a repository. Select the appropriate repository (should be one at this point).
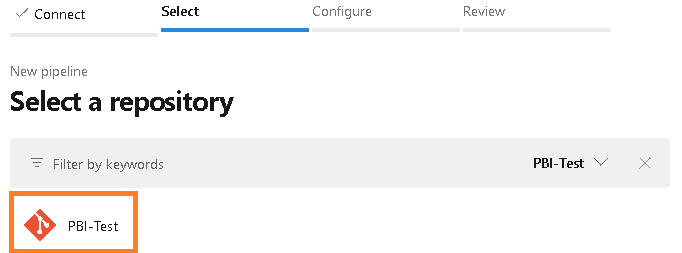 Figure 13 – Select a repository
You will be prompted to configure your pipeline. Choose the “Existing Azure Pipelines YAML file” option.
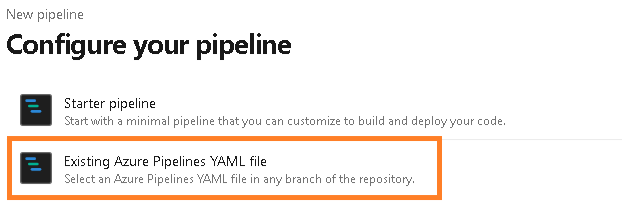 Figure 14 – Configure your pipeline
You will then be prompted with a screen called “Select an existing YAML file”. For the branch choose “development” and for the Path choose “/Scripts/pbi-ci.yml”. Then select Continue.
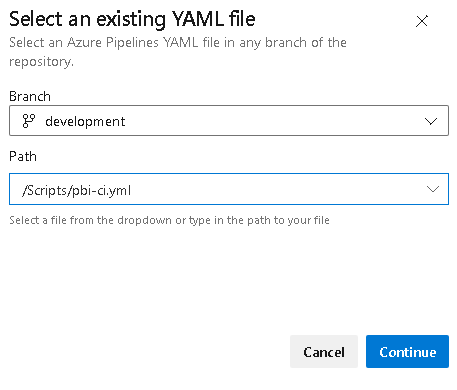 Figure 15 – Example of selecting the branch and yaml file
The “Review your pipeline YAML” page will appear. Select the “Save” option.
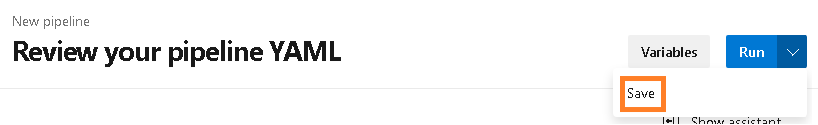 Figure 16 – Save the Pipeline
The pipeline should now be created, and you should rename it. Selectccthe Rename/move option.
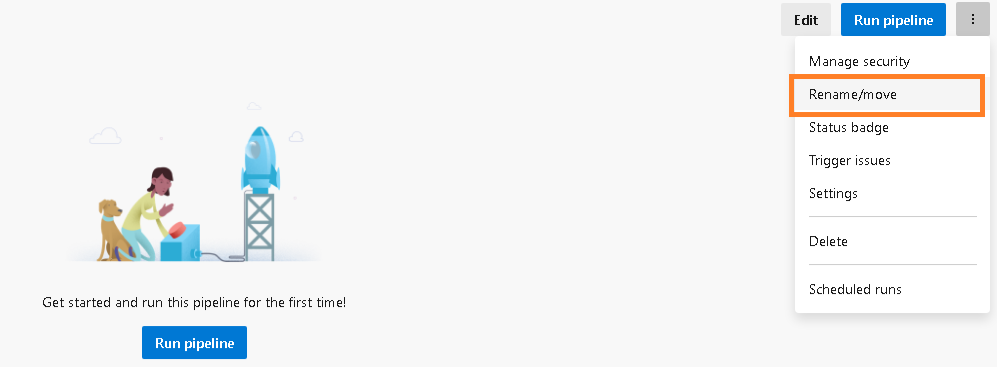 Figure 17 – Rename option
You will be presented with a “Rename/move pipeline” promote. Rename to “PBIP-CI” and then select the “Save” button.
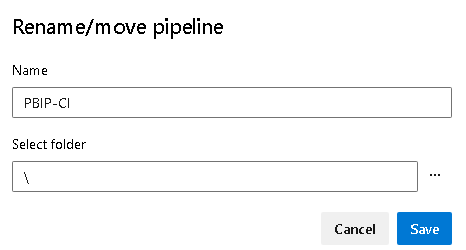 Figure 18 – Rename to PBIP-CI
Test the Pipeline
With the pipeline created and properly named, we’d like to make sure that when we commit and sync a change, the pipeline is triggered. So, from the development branch, perform the following:
Open SampleModel.pbip, located in your local folder in Visual Studio code. Make sure you are also in the development branch.
Then make a few updates to the report. For example, I will update a DAX measure and update the default choices for one of the slicers. After you have completed the changes, save your changes.
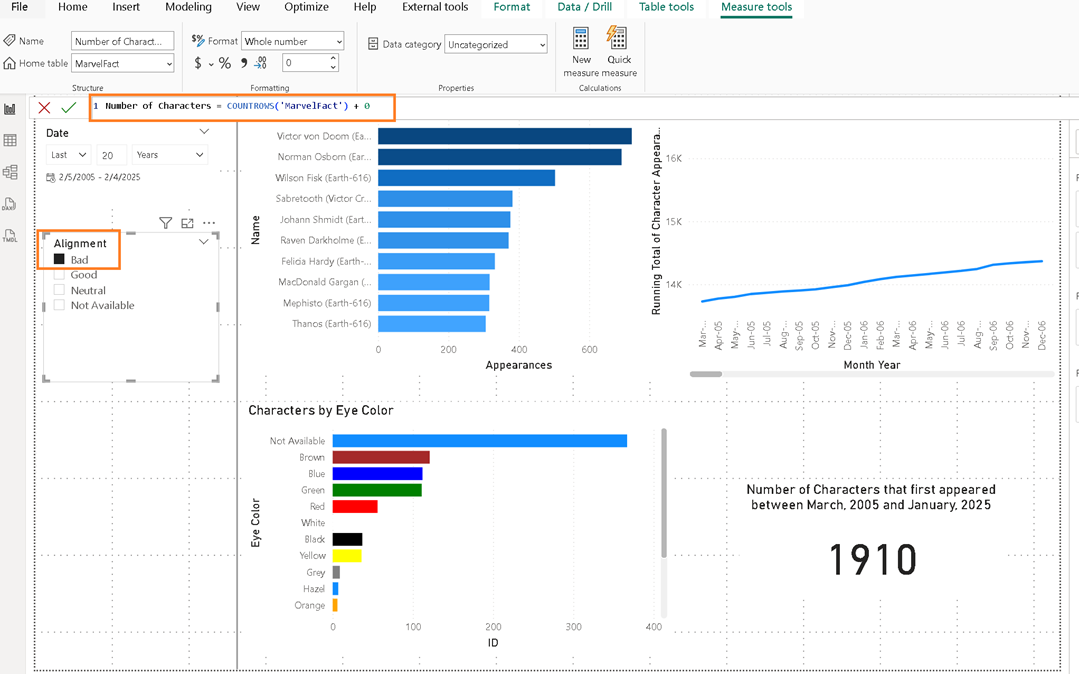 Figure 19 – Example of a measure and slicer change
Commit and sync those changes (this should become a more common sequence for you hopefully).
Once you sync, return to Azure DevOps and view the Pipelines page. You may need to refresh the page to pick up on the changes.
The Continuous Integration pipeline should be running, and you can click on the commit message to drill into the job being executed by the pipeline.
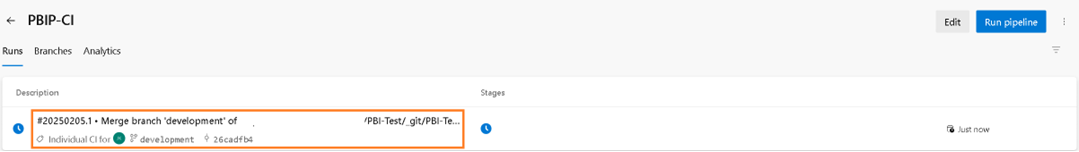 Figure 20 – Select the commit message to view the job results
When the results appear, select the single job that should be running or has completed.
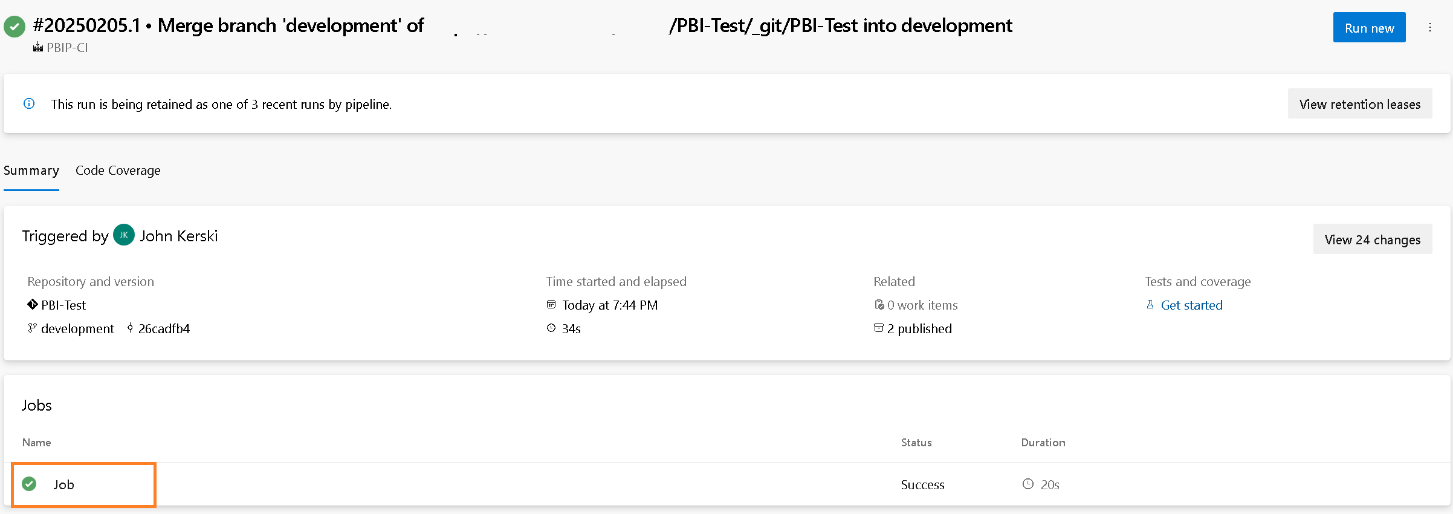 Figure 21 – Select the job to view the steps
This will display a log of all the steps that have been executed (as defined in Figure 1). When finished you should see the two artifacts published by clicking the link labled “2 artifacts published”.
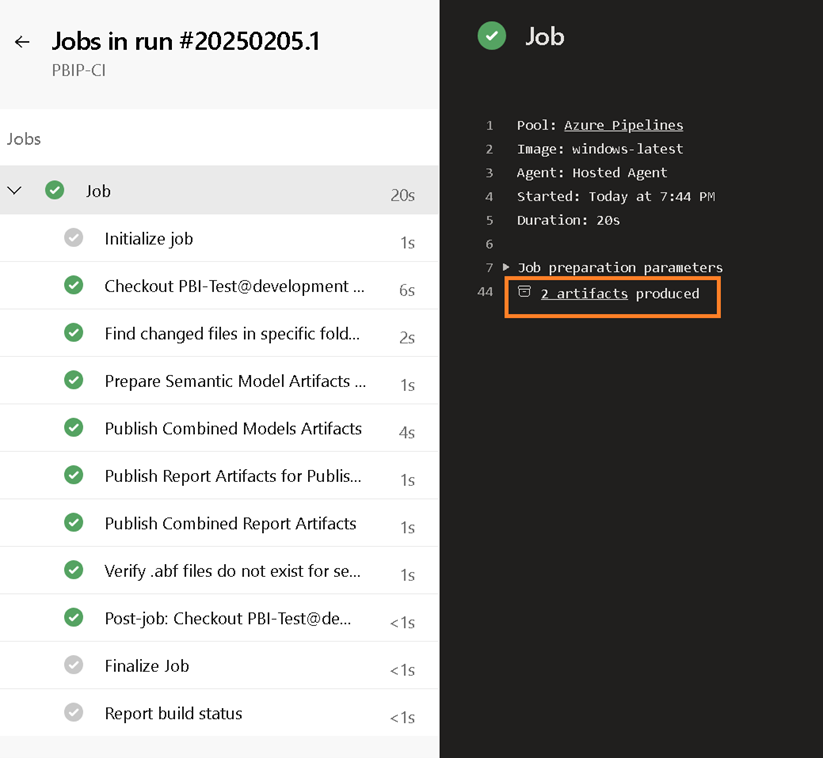 Figure 22 – Display of steps with in the job
Since the SampleModel had both its semantic model (DAX measure) and report (slicer) updated, you should see the contents of each folder (SampleModel.SemanticModel, SampleModel.Report) published.
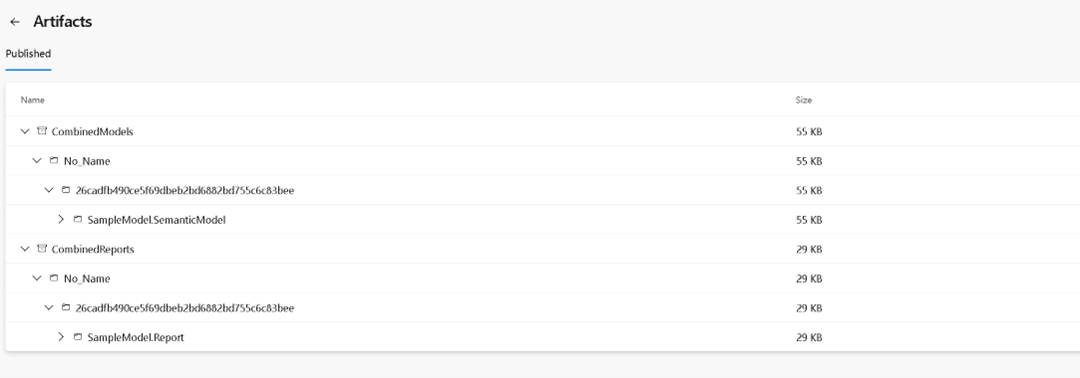 Figure 23 – Example of artifacts published
Next Time
With a Continuous Integration pipeline established we can track changes and set up other Azure DevOps pipelines to do our analyses and testing. More on that in the next post.
Please let me know what you think on LinkedIn.
Note: Some may wonder why I’m showing the “click-by-click” instructions instead of providing a script to automate the installation. That’s a fair question. I wouldn’t expect you to follow these steps manually for every project—you would definitely want to create a script.
However, after years of training others on integrating Power BI with Azure DevOps, I’ve found that introducing trainees to the actual screens helps build “muscle memory.” This, in turn, enhances their understanding of how Continuous Integration works and ultimately makes them better DataOps practitioners.